


Enhancing Dynamics 365 Views: Displaying Icons Dynamically Based on Option Set Values
In this Blog, we will walk through the complete process of displaying icons in a Dynamics 365 view based on the value of an Option Set field. This involves creating a web resource, writing JavaScript, and configuring the view to use the custom column renderer.
Step 1: Create an Option Set Field in Dynamics 365
- 1. Navigate to Power Apps.
- 2. Select the Dataverse environment.
- 3. Go to Tables and choose the table where you want to add icons (e.g., "Attendance").
- 4. Click + Add Column and create an Option Set field:
- Name: izx_in_out
-
Options:
- In → Value: 1
- Out → Value: 2
- Click Save & Close.
-
For Example:
Step 2: Prepare the Icons
We need icons for different statuses.
- 1. Prepare the icon images (.png format):
- izx_green_in.png → Green icon for "In"
- izx_red_out.png → Red icon for "Out"
- new_default_icon.png → Default icon for unknown statuses
- 2. Upload the images as Web Resources:
- Navigate to Power Apps → Solutions.
- Select your solution and click + Add → Web Resource.
- Upload each icon, set the type as Image (PNG), and name them:
- izx_green_in
- izx_red_out
- new_default_icon
- Click Save and Publish.
Step 3: Create a JavaScript Web Resource
Now, we create a JavaScript function to dynamically assign icons in the view.
- 1. Navigate to Power Apps → Solutions.
- 2. Select your solution and click + Add → Web Resource.
- 3. Set the type to JavaScript (JS).
- 4. Name the web resource: izx_SetIconToView.js.
- 5. Copy and paste the following script:
// Function to dynamically set icons based on Option Set values
function customColumnRenderer(rowData, userLCID) {
    debugger;
    var record = JSON.parse(rowData);
    var columnValue = record["izx_in_out"]; // Replace with your field schema name
    var iconUrl = "";
    var tooltipText = "";

    console.log("Column Value:", columnValue); // Debugging

    switch (columnValue) {
        case "In": // If value is 'In'
            iconUrl = "izx_green_in.png"; // Web resource reference
            tooltipText = "Green Icon - In";
            break;
        case "Out": // If value is 'Out'
            iconUrl = "izx_red_out.png";
            tooltipText = "Red Icon - Out";
            break;
        default:
            iconUrl = "new_default_icon.png";
            tooltipText = "Unknown Status";
    }

    console.log("Selected Icon URL:", iconUrl); // Debugging

    return [iconUrl, tooltipText];
}
Save and Publish the script in Power Apps.
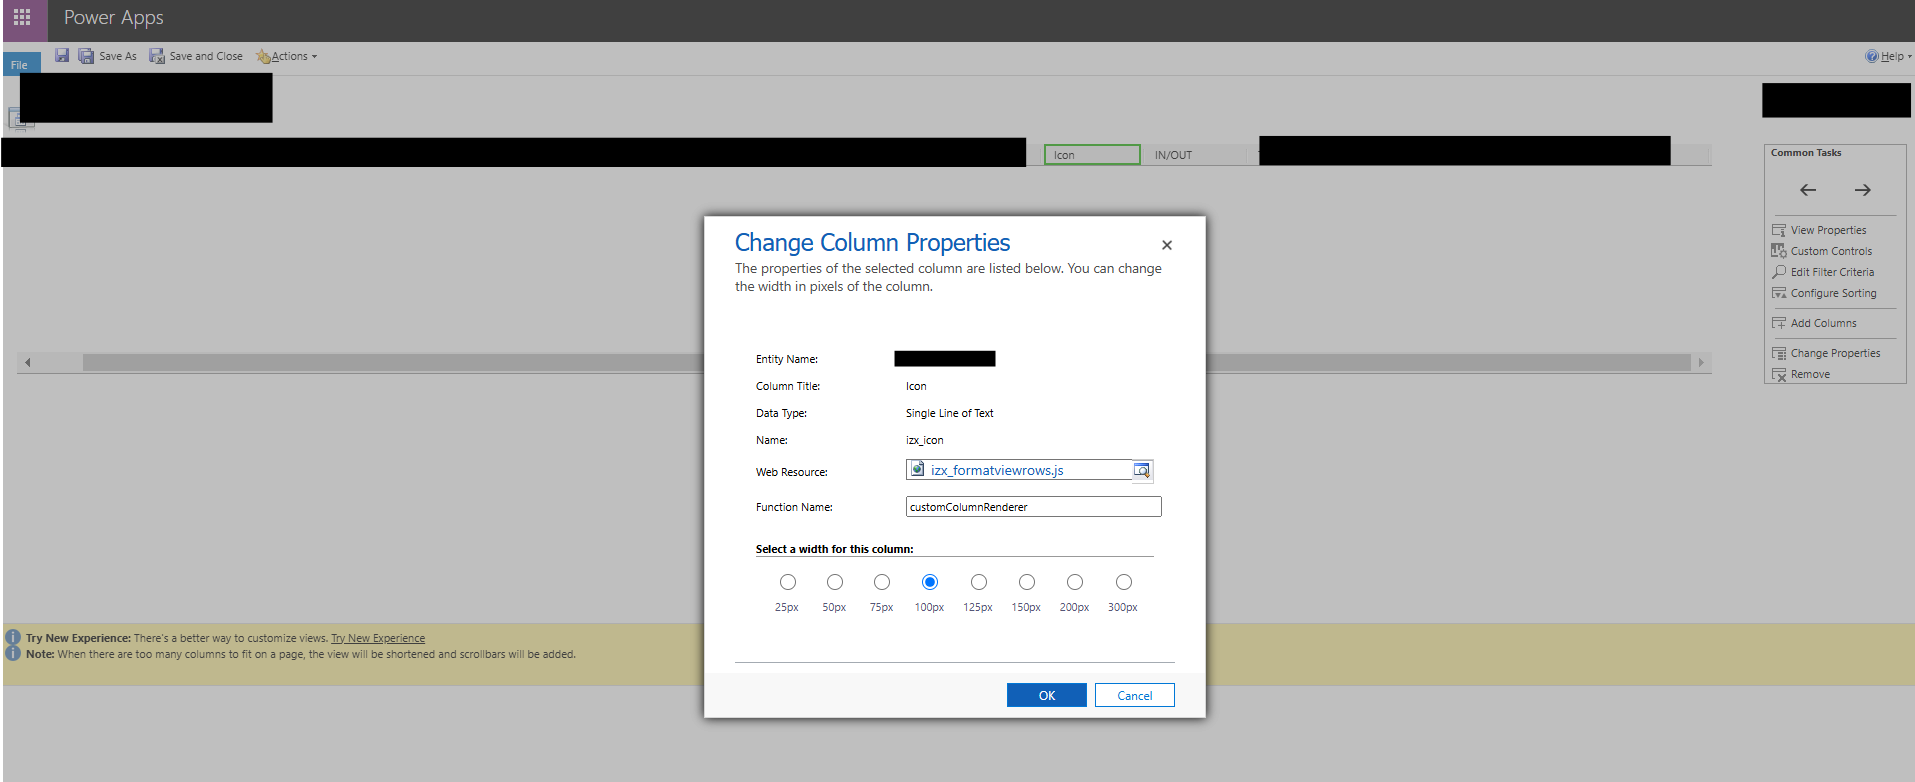
Step 4: Configure the View to Use the JavaScript Renderer
Now, we apply the JavaScript function to the view.
- 1. Navigate to Power Apps → Tables and select your table.
- 2. Go to the Views tab.
- 3. Select the view where you want to show icons (e.g., "Active Attendance Records").
- 4. Click Edit Columns.
- 5. Add a new text column (if not already present):
- Name: izx_icon
- Data Type: Image URL
- 6. Click on Advanced Settings → Customize the System.
- 7. Open the view in the classic designer and select the column to be modified.
- 8. Click Change Properties → Add Custom JavaScript Renderer.
- 9. Set the web resource as izx_SetIconToView.js and the function name as customColumnRenderer.
- 10. Click OK, then Save and Publish the view.
Step 5: Test the Custom Icons in the View
Follow these steps to verify that the custom icons are displayed correctly.
- Open Dynamics 365 and navigate to the entity where you applied the changes.
- Open the view you modified.
- Check whether the correct icons appear based on the izx_in_out field values.
Final Outcome
- When izx_in_out = In → Green icon appears. ✅
- When izx_in_out = Out → Red icon appears. ❌
- If value is unknown → Default icon appears. ⚠️
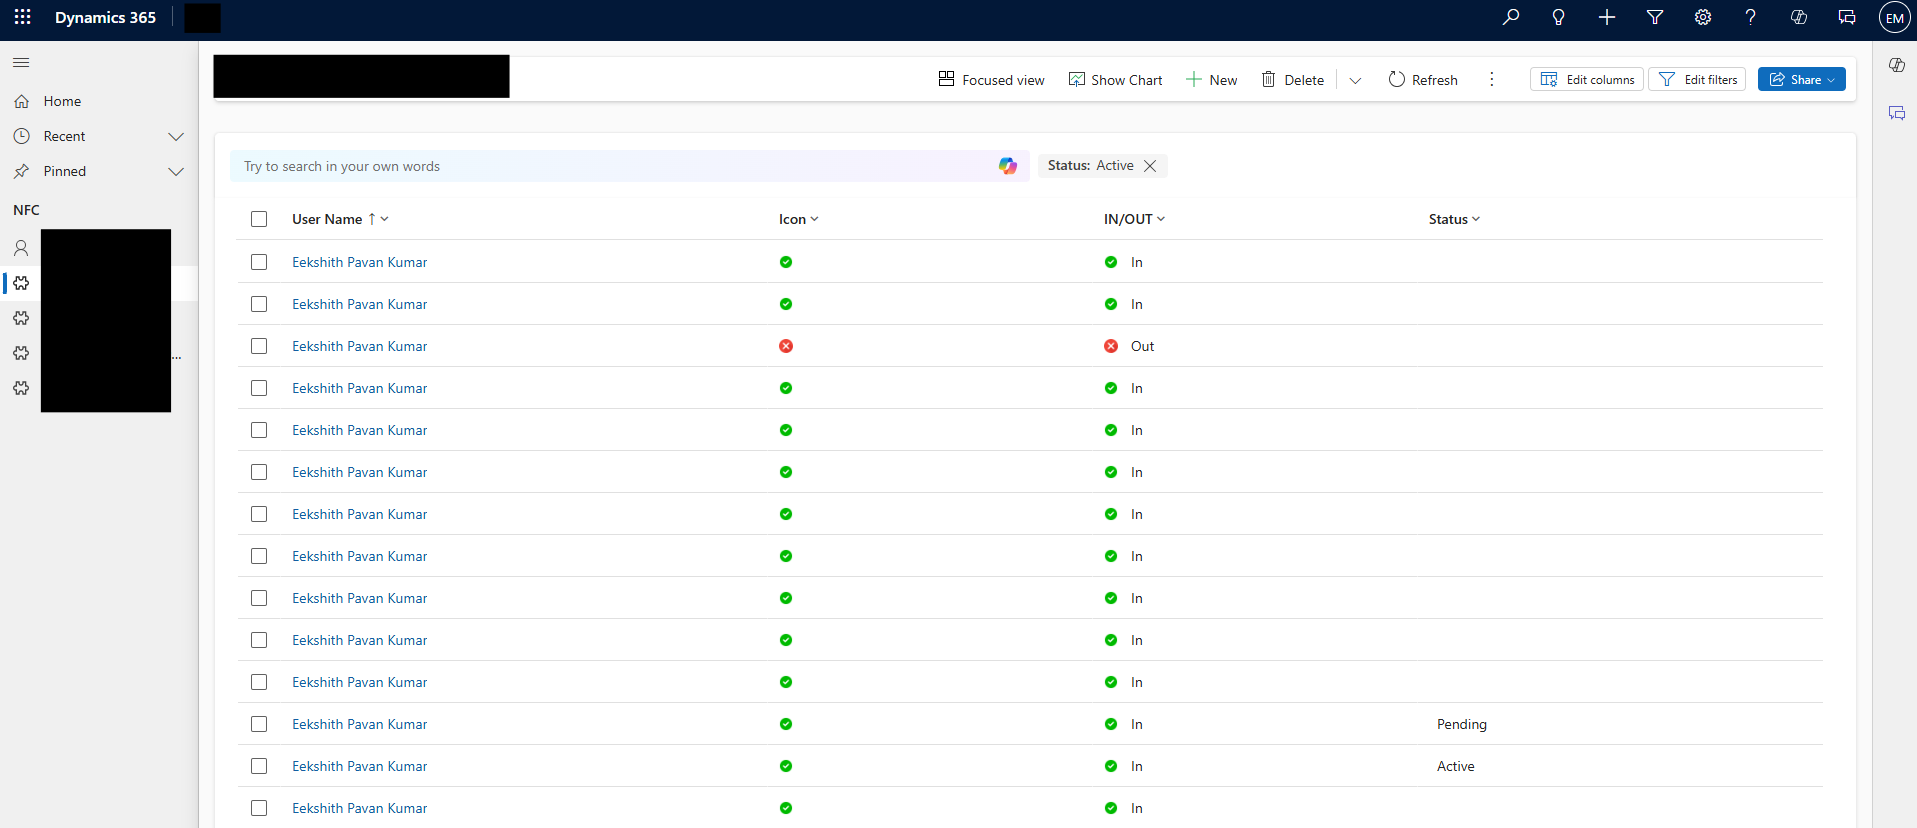
This approach enhances data visualization, making it easier for users to interpret records at a glance.

Enhancing Dynamics 365 Views: Displaying Icons Dynamically Based on Option Set Values


